[ Date Index ] [ Thread Index ] [ <= Previous by date / thread ] [ Next by date / thread => ]
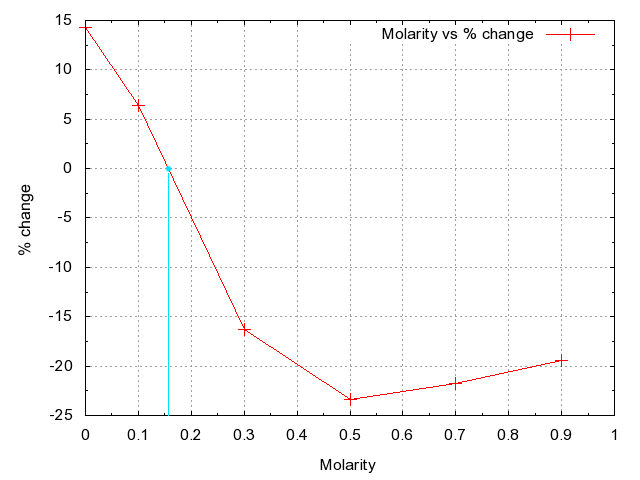
>>
> You're welcome.
>
> By the way, I also noticed that you wanted to add a vertical line where
> your plot crossed zero. That's a slightly deeper question, as The OOo
> plot is using straight lines to join the points, and the estimated zero
> point would probably lie on a fitted curve.
>
> If you do need to do that, you would probably need to use a linear model
> in a package like R, and then add the line based on the estimated zero
> point. Looking at your data it could be modelled by a quadratic (e.g. y
> ~ f[x, x^2]). You would, of course, fit the curve to all the data,
> rather than the averages for each molarity.

I'd never heard of R before today, but I'll definately take a look at
it.  I'll be studying Nursing for the next three years at uni, during
the first year I'll still be doing the biology so may need it.

>
> Otherwise you could estimate the zero point by "eye-balling" it.

In order to get the work done that's pretty much what I did, I used a
vertical rule in a drawing program to add the line and a blob at the
point.  I've attached the final thing if anyone wants a look.
Attachment:
chart2.png
Description: PNG image
--
The Mailing List for the Devon & Cornwall LUG
http://mailman.dclug.org.uk/listinfo/list
FAQ: http://www.dcglug.org.uk/linux_adm/list-faq.html